TensorBoard
Run the following command to plot a chart of the metric value dynamics in TensorBoard during the training procedure:
tensorboard --logdir=<train_dir>
train_dir is the directory for storing the files generated during training. This directory is specified in the training parameters.
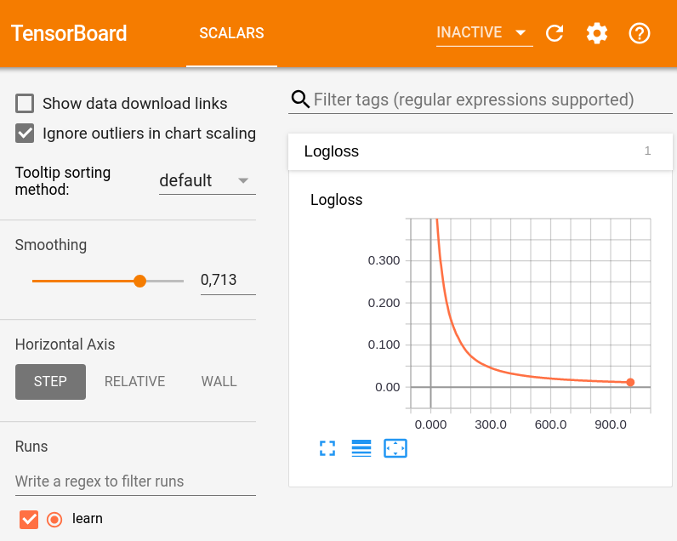
An example of a plotted chart
Was the article helpful?
Previous
Next