MetricVisualizer
class MetricVisualizer(train_dirs,
                       subdirs=False)
Purpose
Plot information regarding training, metric evaluations or cross-validation runs on a single chart. One chart can contain information regarding one or several runs depending on the input information. The charts can be either plotted in real time while the trainings are performed, or after the trainings are over.
Parameters
train_dirs
Description
The directory or the list of directories to read the files generated during training.
Possible types
- string
- list of strings
Default value
catboost_info
subdirs
Description
Gather and read data from the specified directories and all subdirectories.
Possible types
bool
Default value
False (the data for charts is gathered from the specified directories only)
Methods
Method: start
Plot metrics for all training, metric evaluations and cross-validation runs that have logs in the given directory.
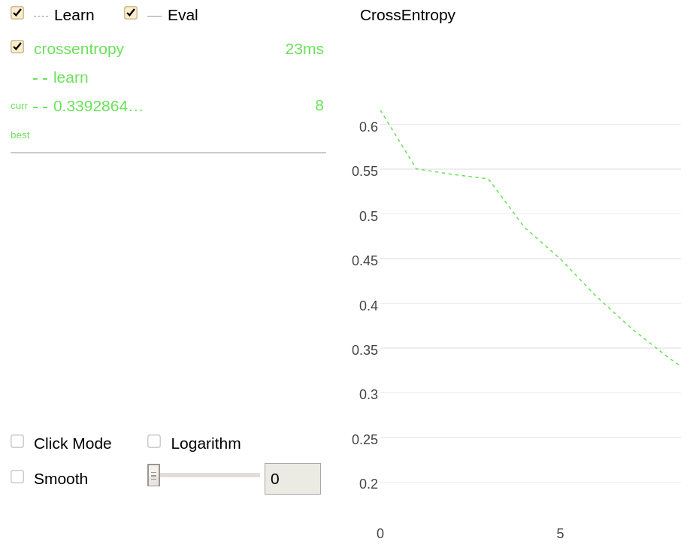
Gather data from the specified directory only
Train a model from the root of the file system (
/):from catboost import CatBoostClassifier cat_features = [0,1,2] train_data = [["a", "b", 1, 4, 5, 6], ["a", "b", 4, 5, 6, 7], ["c", "d", 30, 40, 50, 60]] train_labels = [1,1,0] model = CatBoostClassifier(iterations=20, loss_function = "CrossEntropy", train_dir = "crossentropy") model.fit(train_data, train_labels, cat_features) predictions = model.predict(train_data)Plot a chart using the information regarding the previous training (from the
crossentropydirectory):import catboost w = catboost.MetricVisualizer('/crossentropy/') w.start()The following is a chart plotted with Jupyter Notebook for the given example.
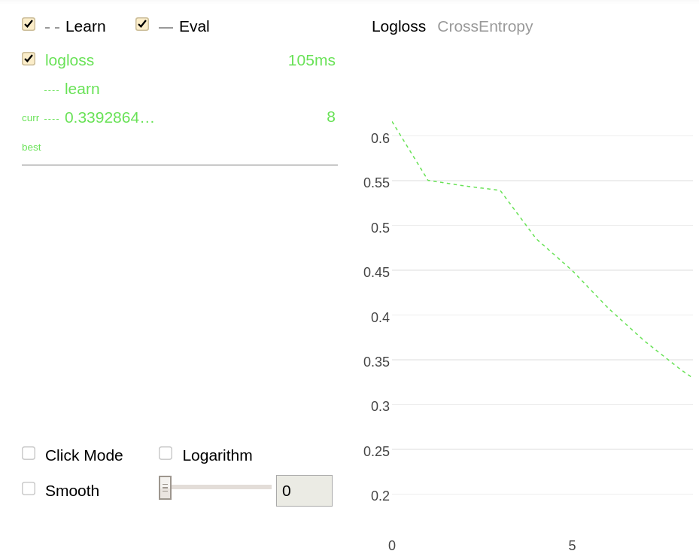
Gather and read data from all subdirectories
Train two models from the root of the file system (
/):from catboost import CatBoostClassifier cat_features = [0,1,2] train_data = [["a", "b", 1, 4, 5, 6], ["a", "b", 4, 5, 6, 7], ["c", "d", 30, 40, 50, 60]] train_labels = [1,1,0] model = CatBoostClassifier(iterations=20, loss_function = "CrossEntropy", train_dir = "crossentropy") model.fit(train_data, train_labels, cat_features) predictions = model.predict(train_data)from catboost import CatBoostClassifier cat_features = [0,1,2] train_data = [["a", "b", 1, 4, 5, 6], ["a", "b", 4, 5, 6, 7], ["c", "d", 30, 40, 50, 60]] train_labels = [1,1,0] model = CatBoostClassifier(iterations=20, train_dir = "logloss") model.fit(train_data, train_labels, cat_features) predictions = model.predict(train_data)Plot charts using the information from all subdirectories (
crossentropyandlogloss) of the root of the file system:import catboost w = catboost.MetricVisualizer('/', subdirs=True) w.start()The following is a chart plotted with Jupyter Notebook for the given example.