calc_feature_statistics
Calculate and plot a set of statistics for the chosen feature.
An example of plotted statistics:
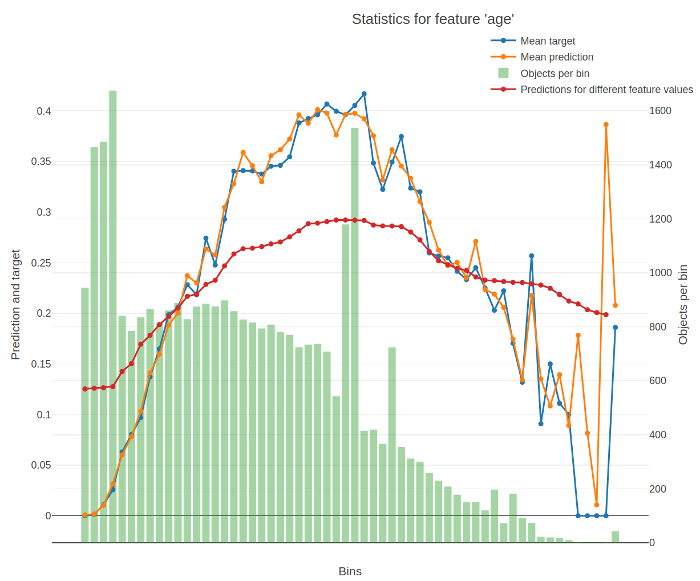
The X-axis of the resulting chart contains values of the feature divided into buckets. For numerical features, the splits between buckets represent conditions (feature < value) from the trees of the model. For categorical features, each bucket stands for a category.
The Y-axis of the resulting chart contains the following graphs:
-
Average target (label) value in the bucket.
-
Average prediction in the bucket.
-
Number of objects in the bucket.
-
Average predictions on varying values of the feature.
To calculate it, the value of the feature is successively changed to fall into every bucket for every input object. The value for a bucket on the graph is calculated as the average for all objects when their feature values are changed to fall into this bucket.
The return value of the function contains the data from these graps.
The following information is used for calculation:
- Trained model
- Dataset
- Label values
Alert
- Only models with one-hot encoded categorical features are supported. Set the
one_hot_max_sizeparameter to a large value to ensure that one-hot encoding is applied to all categorical features in the model. - Multiclassification modes are not supported.
Method call format
calc_feature_statistics(data,
                        target=None,
                        feature=None,
                        prediction_type=None,
                        cat_feature_values=None,
                        plot=True,
                        max_cat_features_on_plot=10,
                        thread_count=-1,
                        plot_file=None)
Parameters
data
Description
The data to calculate the statistics on.
Possible types
- numpy.ndarray
- pandas.DataFrame
- pandas.SparseDataFrame
- polars.DataFrame
- scipy.sparse.spmatrix (all subclasses except dia_matrix)
Default value
Required parameter
target
Description
Label values for objects from the input data.
Possible types
- numpy.ndarray
- pandas.Series
- polars.Series
Default value
Required parameter
feature
Description
The feature index, name or a list of any their combination to calculate the statistics for.
Usage examples
Output information regarding a single feature indexed 0:
feature=0
Output information regarding two features, one of which is named age and the second is indexed 10:
feature=["age", 10]
Possible types:
- int
- string
- list of int, string or their combination
Default value
Required parameter
prediction_type
Description
The prediction type to calculate the mean prediction.
Possible values:
- Probability
- Class
- RawFormulaVal
- Exponent
- LogProbability
Possible types
string
Default value
None (Probability for Logloss and CrossEntropy, RawFormulaVal for all other loss functions)
cat_feature_values
Description
A list of categorical feature values to calculate the statistics on. Can be used if statistics are calculated for a categorical feature.
Possible types
- list
- numpy.ndarray
- pandas.Series
Default value
None (statistics are calculated for all values of categorical feature)
plot
Description
Plot a Jupyter Notebook chart based on the calculated statistics.
Possible types
bool
Default value
True
max_cat_features_on_plot
Description
The maximum number of different values of a categorical feature to output on one chart.
If the selected categorical feature takes more different values than the value set in this parameter, several charts are plotted.
Possible types
int
Default value
10
thread_count
Description
The number of threads to use for calculating statistics.
Possible types
int
Default value
-1 (the number of threads is equal to the number of processor cores)
plot_file
Description
The name of the output file to save the chart to.
Possible types string
Default value None (the file is not saved)
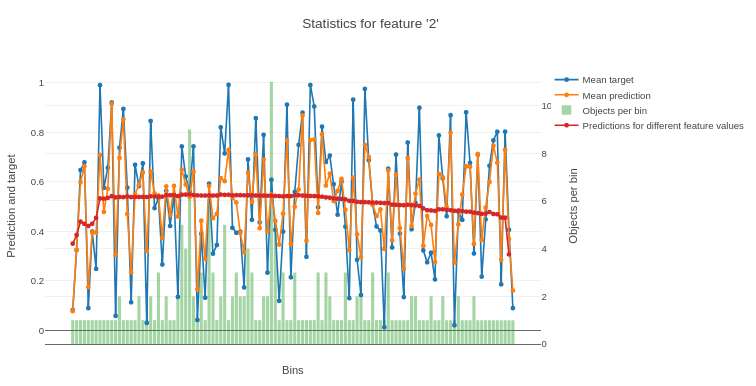
Usage examples
from catboost import CatBoostRegressor
import numpy as np

train_data = np.random.rand(200, 10)
label_values = np.random.rand(200)

model = CatBoostRegressor()
model.fit(train_data, label_values)

res = model.calc_feature_statistics(train_data,
                                    label_values,
                                    feature=2,
                                    plot=True)
The following is a chart plotted with Jupyter Notebook for the given example.