cv
cv(pool=None,
   params=None,
   dtrain=None,
   iterations=None,
   num_boost_round=None,
   fold_count=3,
   nfold=None,
   inverted=False,
   partition_random_seed=0,
   seed=None,
   shuffle=True,
   logging_level=None,
   stratified=None,
   as_pandas=True,
   metric_period=None,
   verbose=None,
   verbose_eval=None,
   plot=False,
   early_stopping_rounds=None,
   folds=None,
   type='Classical',
   return_models=False)
Purpose
Perform cross-validation on the dataset.
The dataset is split into N folds. N–1 folds are used for training, and one fold is used for model performance estimation. N models are updated on each iteration K. Each model is evaluated on its' own validation dataset on each iteration. This produces N metric values on each iteration K.
The cv function calculates the average of these N values and the standard deviation. Thus, these two values are returned on each iteration.
If the dataset contains group identifiers, all objects from one group are added to the same fold when partitioning is performed.
Parameters
pool
Alias: dtrain
Description
The input dataset to cross-validate.
Possible types
Default value
Required parameter
params
Description
The list of parameters to start training with.
Note
- The following parameters are not supported in cross-validation mode:
save_snapshot,
--snapshot-file
,snapshot_interval. - The behavior of the overfitting detector is slightly different from the training mode. Only one metric value is calculated at each iteration in the training mode, while
fold_countmetric values are calculated in the cross-validation mode. Therefore, allfold_countvalues are averaged and the best iteration is chosen based on the average metric value at each iteration.
Possible types
dict
Default value
Required parameter
iterations
Aliases: num_boost_round, n_estimators, num_trees
Description
The maximum number of trees that can be built when solving machine learning problems.
When using other parameters that limit the number of iterations, the final number of trees may be less than the number specified in this parameter.
Possible types
int
Default value
1000
fold_count
Alias: nfold
Description
The number of folds to split the dataset into.
Possible types
int
Default value
3
inverted
Description
Train on the test fold and evaluate the model on the training folds.
Possible types
bool
Default value
False
partition_random_seed
Alias: seed
Description
Use this as the seed value for random permutation of the data.
The permutation is performed before splitting the data for cross-validation.
Each seed generates unique data splits.
Possible types
int
Default value
0
shuffle
Description
Shuffle the dataset objects before splitting into folds.
Possible types
bool
Default value
True
logging_level
Description
The logging level to output to stdout.
Possible values:
-
Silent — Do not output any logging information to stdout.
-
Verbose — Output the following data to stdout:
- optimized metric
- elapsed time of training
- remaining time of training
-
Info — Output additional information and the number of trees.
-
Debug — Output debugging information.
Possible types
string
Default value
None (corresponds to the Verbose logging level)
stratified
Description
Perform stratified sampling.
It is turned on (True) by default if one of the following loss functions is selected: Logloss, MultiClass, MultiClassOneVsAll.
It is turned off (False) for all other loss functions by default.
Possible types
bool
Default value
None
as_pandas
Description
Sets the type of return value to pandas.DataFrame.
The type of return value is dict if this parameter is set to False or the pandasPython package is not installed.
Possible types
bool
Default value
True
metric_period
Description
The frequency of iterations to calculate the values of objectives and metrics. The value should be a positive integer.
The usage of this parameter speeds up the training.
Possible types
int
Default value
1
verbose
Alias: verbose_eval
Description
The purpose of this parameter depends on the type of the given value:
-
bool — Defines the logging level:
True
corresponds to the Verbose logging levelFalse
corresponds to the Silent logging level
-
int — Use the Verbose logging level and set the logging period to the value of this parameter.
Possible types
- bool
- int
Default value
False
plot
Description
Plot the following information during training:
- the metric values;
- the custom loss values;
- the loss function change during feature selection;
- the time has passed since training started;
- the remaining time until the end of training.
This option can be used if training is performed in Jupyter notebook.
Possible types
bool
Default value
False
early_stopping_rounds
Description
Sets the overfitting detector type to Iter and stops the training after the specified number of iterations since the iteration with the optimal metric value.
Possible types
int
Default value
False
folds
Description
Custom splitting indices.
The format of the input data depends on the type of the parameter:
- generator or iterator — Train and test indices for each fold.
-
object — One of the scikit-learn Splitter Classes with the
splitmethod.
This parameter has the highest priority among other data split parameters.
Possible types
- generator
- iterator
- scikit-learn splitter object
Default value
None
type
Description
The method to split the dataset into folds.
Possible values:
-
Classical — The dataset is split into
fold_countfolds,fold_counttrainings are performed. Each test set consists of a single fold, and the corresponding train set consists of the remaining k–1 folds. -
Inverted — The dataset is split into
fold_countfolds,fold_counttrainings are performed. Each test set consists of the first k–1 folds, and the corresponding train set consists of the remaining fold. -
TimeSeries — The dataset is split into (
fold_count+ 1) consecutive parts without shuffling the data,fold_counttrainings are performed. The k-th train set consists of the first k folds, and the corresponding test set consists of the (k+1)-th fold.
Possible types
string
Default value
Classical
return_models
Description
If return_models is True, returns a list of models fitted for each CV fold. By default, False.
Possible types
bool
Default value
False
Type of return value
Depends on return_models, as_pandas, and the availability of the pandasPython package:
- If
return_modelsisFalse,cvreturnscv_resultswhich is a dict or a pandas frame (see a table below). - If
return_modelsisTrue,cvreturns a tuple (cv_results,fitted_models) containing, in addition to regularcv_results, a list of models fitted for each fold.
as_pandas value |
pandasPython package availability |
Type of return value |
|---|---|---|
| True | Installed | pandas.DataFrame |
| True | Not installed | dict |
| False | Unimportant | dict |
The first key (if the output type is dict) or column name (if the output type is pandas.DataFrame) contains the iteration of the calculated metrics values on the corresponding line. Each following key or column name is formed from the evaluation dataset type (train or test), metric name, and computed characteristic (std, mean, etc.). Each value is a list of corresponding computed values.
For example, if only the RMSE metric is specified in the parameters, then the return value is:
    iterations  test-Logloss-mean  test-Logloss-std  train-Logloss-mean  train-Logloss-std
0            0           0.693219          0.000101            0.684767           0.011851
1            1           0.682687          0.014995            0.674235           0.003043
2            2           0.672758          0.029630            0.655983           0.005906
3            3           0.668589          0.023734            0.648127           0.005204
Each key or column value contains the same number of calculated values as the number of training iterations (or less, if the overfitting detection is turned on and the threshold is reached earlier).
Examples
Perform cross-validation on the given dataset:
from catboost import Pool, cv
cv_data = [["France", 1924, 44],
["USA", 1932, 37],
["Switzerland", 1928, 25],
["Norway", 1952, 30],
["Japan", 1972, 35],
["Mexico", 1968, 112]]
labels = [1, 1, 0, 0, 0, 1]
cat_features = [0]
cv_dataset = Pool(data=cv_data,
label=labels,
cat_features=cat_features)
params = {"iterations": 100,
"depth": 2,
"loss_function": "Logloss",
"verbose": False}
scores = cv(cv_dataset,
params,
fold_count=2,
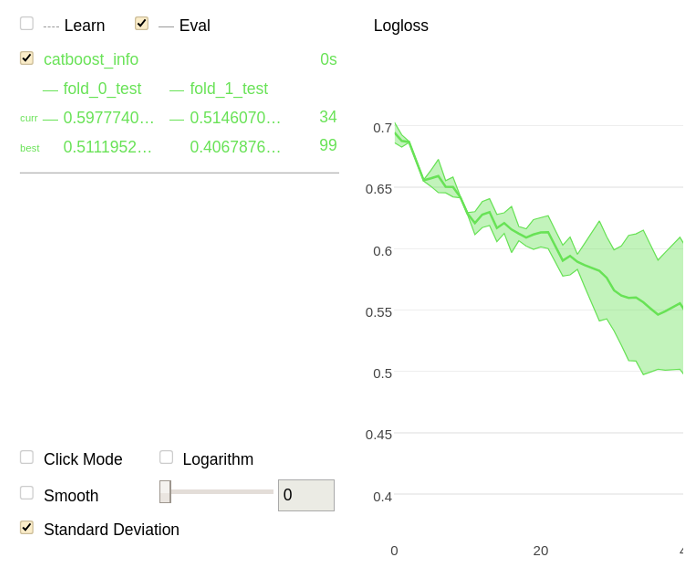
plot="True")
The following is a chart plotted with Jupyter Notebook for the given example.
Perform cross-validation and save ROC curve points to the roc-curve output file:
from catboost import Pool, cv

cv_data = [["France", 1924, 44],
           ["USA", 1932, 37],
           ["Switzerland", 1928, 25],
           ["Norway", 1952, 30],
           ["Japan", 1972, 35],
           ["Mexico", 1968, 112]]

labels = [1, 1, 0, 0, 0, 1]

cv_dataset = Pool(data=cv_data,
                  label=labels,
                  cat_features=[0])

params = {"iterations": 100,
          "depth": 2,
          "loss_function": "Logloss",
          "verbose": False,
          "roc_file": "roc-file"}

scores = cv(cv_dataset,
            params,
            fold_count=2)